
Tak.
Takafumi Megumi standing in a park in Vancouver

Hi, I'm Tak

Takafumi Megumi

UI/UX Γ—
Engineering

6+ years of growing products people use.

Based in Vancouver, Canada πŸ‡¨πŸ‡¦

About me

A full-stack engineer with a product manager's instincts.

At a small startup in Tokyo, I owned features end to end: finding the user problem, planning the solution, building it, and measuring the result after release.

I'm based in Vancouver and authorized to work full-time in Canada, no sponsorship required.

6+Years building
products

70+Features &
experiments

Open to

  • Product Engineer
  • Full-stack Engineer
  • Frontend Engineer

How I work

  • User research & A/B testing
  • AI-assisted development
  • Agile & Scrum

Hobby

  • πŸ₯Ύ Hiking in BC
  • ⚽️ Playing soccer
  • πŸ“Ί Watching anime

Experience

RENGA, Inc.

Full Stack Engineer Β· Contract

A condo review and search platform

2026 – Present

  • React
  • TypeScript
  • Java
  • MySQL
  • Claude Code
  • 35% more users replying to search suggestions more than once, by turning a card list into a one-at-a-time chat
  • 22% β†’ 38% of users rating listings, by adding three rating prompts to the listing page
  • 1.5 weeks to build, solo, a screen where users pick areas to prefer or avoid, using a spec-first AI workflow
Product Owner

A condo review and search platform

2025

  • Figma
  • Google Maps API
  • React
  • TypeScript
  • Java
  • 43% higher sign-up conversion by leading a search map colored by resident-review scores
  • 5 of 5 interviewees said they would sign up, after trying my map-search prototype in Figma
  • 12-week project led as acting product owner, from user stories to the A/B readout

Scrum Master

A gym member app

2025

  • React Native
  • Expo
  • Hono.js
  • PostgreSQL
  • AWS Lambda
  • 3 retention features, from visit scheduling to a prize lottery, shipped on time in three months
  • Less code-review rework, by reviewing written, diagrammed designs as a team before coding
  • A prize lottery that never gives one prize to two winners, built with tests and an audit log

Full Stack Engineer

A condo review and search platform

2021 – 2025

  • React
  • TypeScript
  • Java
  • Sass
  • MySQL
  • 16.5x paid members in two years, by replacing pay-per-view with a review subscription
  • 58% higher sign-up conversion by locking reviews until people post one or subscribe
  • 24 hours a week saved on persona and journey-map work by trimming the template

LITALICO, Inc.

Full Stack Engineer

A job-search service for people with disabilities

2020 – 2021

  • Ruby on Rails
  • React
  • TypeScript
  • MySQL
  • 120% of target for inquiries from job seekers, a month early, by shipping 30+ UI improvements
  • A success-stories section launched from designer prototypes to schema and admin pages
  • 3 new-grad engineers onboarded through a three-month program I designed

Projects

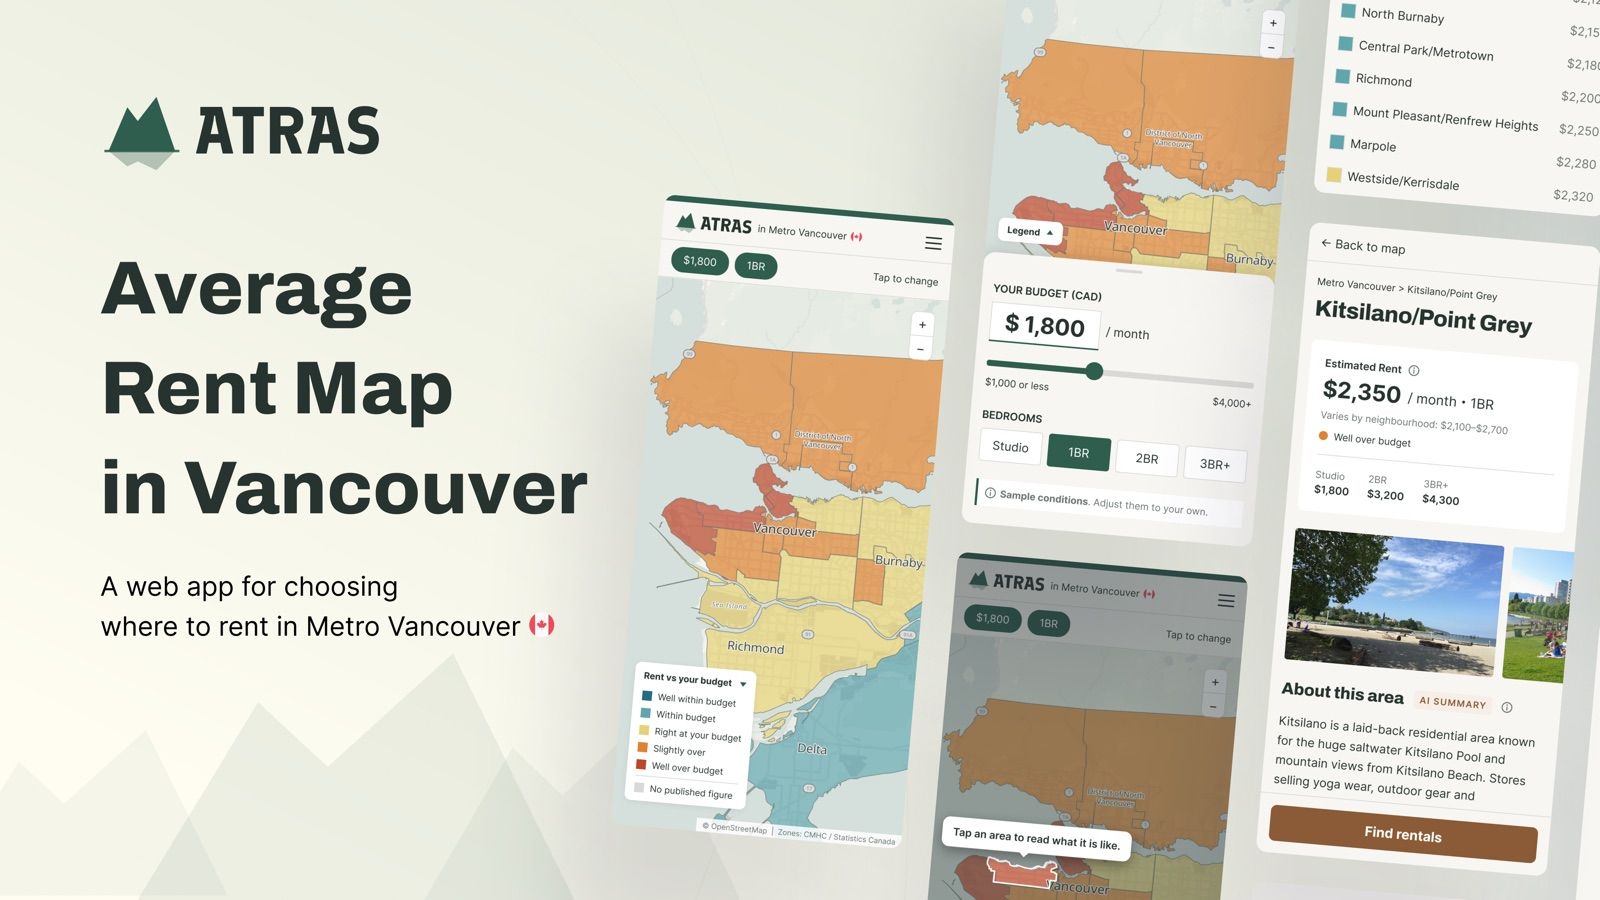
ATRAS

Helping newcomers to Vancouver find neighbourhoods they can afford

ATRAS, the Average Rent Map in Vancouver, shown on phone screens
  • TypeScript
  • JavaScript
  • React
  • React Native
  • Expo
  • Astro
  • Sass
  • Jest
  • Figma
  • Java
  • Node.js
  • Hono
  • Ruby on Rails
  • MySQL
  • PostgreSQL
  • AWS
  • Cloudflare
  • Python
  • Claude Code

Want to see this site's code?

It's all on GitHub.

View on GitHub

Let's talk.

I'm looking for my next full-time role in Vancouver. Book a short call, or just send a message.

Loading open times…

← Back
Solo productPM & Engineering

ATRAS

A rent map for first-time renters in Vancouver

Role
Product, design & engineering (solo)
Timeline
Jul – Sep 2026 (2 months)
Tech
Astro, React, MapLibre, Claude API
ATRAS, the Average Rent Map in Vancouver, shown on phone screens

Overview

See which neighbourhoods fit your budget, before you search for a room.

Newcomers to Vancouver know their budget, but not the city. Rent statistics by area already exist, but only in tools built for researchers.

ATRAS turns them into one map. Enter a budget and a bedroom count, and every neighbourhood is colored by how far it sits from that budget.

Research

Newcomers don't ask where to live. They ask where they can afford.

I combined public statistics with Reddit threads from people moving to Vancouver.

90%
of Metro Vancouver's population growth through 2051 is forecast to come from immigration
29%
of international students in Vancouver live in housing too small for their household, about twice the rate of Canadian-born students
1.7x
the gap in average one-bedroom rent between the cheapest and the priciest rental zone

Sources: Metro Vancouver population forecast (2025), Statistics Canada 2021 Census analysis (2024), CMHC Rental Market Survey (Oct 2025)

Defining the MVP

What to build in two months, and what to leave out

I had two months and no backend, so I set three rules and wrote down what I would not build.

  1. 1

    Compare by neighbourhood

    Cities were too broad and listing pins too detailed. CMHC's 25 rental zones were the right size.

  2. 2

    Color by distance from the budget

    Five colors, from well under budget to well over it.

  3. 3

    Let AI write, not decide the facts

    Each summary uses only public data I collected, and I checked every zone by eye.

Left out on purpose

  • Individual listings. Rental sites already do this, and collecting their data carries legal risk.
  • Open review posting. Reviews come from people I asked directly, with consent.
  • Cities other than Vancouver.

Solution

A map that reacts, and reviews you can trust.

Two features carry the product.

Move your budget, watch the map change

All 25 zones recolor the moment you change your budget or bedroom count.

Hear from people who lived there

Past residents rate safety at night, friendly neighbours, groceries, and transit, and say what they liked and didn't.

A review on a phone: a resident since 2026 rates the area 5 out of 5, with ratings for safety, neighbours, groceries, and transit, and their pros and cons

UI Components

The design system behind the map

In Figma, I set the five budget colors, the type, and components such as the budget input, the legend, and the area panel. Then I built them in React.

The map of Metro Vancouver with each area colored by how its rent compares to a $2,200 budget
MapEvery area, colored by your budget
The budget sheet with a slider set to $2,200 and bedroom buttons
BudgetBudget and bedrooms in one sheet
A hint over the map that says: Tap an area to read what it is like
HintA hint points to the next step
Kitsilano/Point Grey outlined on the map, with its estimated rent below
AreaThe chosen area, outlined
The Kitsilano/Point Grey page with rent for each size, photos, and an AI summary
DetailsRent by size, photos, and a summary
A resident review with ratings, pros, and cons
ReviewsRatings and words from residents
A dialog explaining that the AI summary uses only public data
AI summaryEach summary says what it is based on
Moodboard: forest, ivory, and cedar colors with BC mountain and lake photos
ATRAS logo: a mountain mark reflected in water, in green and white
Type scale, from the area name to body text and price
Make an unfamiliar city a place you want to live.

Thanks for reading

Questions about ATRAS? I'm happy to walk you through it.